What do UK search-market statistics actually measure?
UK search statistics describe people, queries, referrals or expenditure. Each measure answers a different question. Use the label beside the number before comparing two reports.
The CMA measures query volume using provider data. Statcounter measures referrals to participating websites.
A Google search that ends without a click can enter the first measure and never appear in the second. The two Google percentages are therefore compatible without being interchangeable.
Search advertising expenditure measures paid-media investment. The £17.9bn reported by IAB UK is not the revenue of UK SEO agencies or the value of organic traffic. A broader internet-marketing industry estimate also cannot establish the size of SEO alone.
Choose the source that matches the claim. Use a survey for reported behaviour. Use referral measurement for clicked traffic.
Use provider query data for search volume. Check the measurement month before describing any figure as current.
How many marketing agencies are there in the UK?
The UK had 18,985 advertising agencies (SIC 73.11) on the VAT and/or PAYE business register in 2026, up 8.6% on 2025, according to the Office for National Statistics. London alone accounts for 6,060 of them, and 83.9% employ fewer than five people.
These are ONS enterprise counts on the VAT/PAYE register, not Companies House company registrations, and not a count of SEO agencies. SEO and digital agencies can also register under other SIC codes, such as public relations or management consultancy, and businesses trading below the VAT and PAYE thresholds are excluded entirely. Treat the figures as a market-size proxy, not a directory total.
| SIC class | 2025 | 2026 | Change |
|---|
| 73.11 Advertising agencies | 17,485 | 18,985 | +8.6% |
| 70.21 Public relations and communication activities | 6,155 | 6,450 | +4.8% |
| 73.12 Media representation | 3,850 | 3,985 | +3.5% |
These three SIC classes are shown separately because they describe different activities. Do not add them together and quote the total as a single agency figure without saying which classes it sums.
Advertising agencies concentrate around London and the South East. The table below shows the 2026 count for each UK region and its share of the UK total, calculated from the ONS regional breakdown.
| Region | Agencies, 2026 | Share of UK |
|---|
| London | 6,060 | 31.9% |
| South East | 3,070 | 16.2% |
| North West | 1,950 | 10.3% |
| East | 1,805 | 9.5% |
| South West | 1,395 | 7.3% |
| West Midlands | 1,110 | 5.8% |
| Yorkshire and The Humber | 1,090 | 5.7% |
| East Midlands | 880 | 4.6% |
| Scotland | 665 | 3.5% |
| Wales | 370 | 1.9% |
| North East | 365 | 1.9% |
| Northern Ireland | 225 | 1.2% |
Most advertising agencies are small. Of the 18,985 UK enterprises in this class, 83.9% employ 0 to 4 people, and 0.8% employ 100 or more.
| Employee size band | Agencies, 2026 | Share of UK |
|---|
| 0 to 4 | 15,935 | 83.9% |
| 5 to 9 | 1,390 | 7.3% |
| 10 to 19 | 790 | 4.2% |
| 20 to 49 | 520 | 2.7% |
| 50 to 99 | 205 | 1.1% |
| 100 to 249 | 80 | 0.4% |
| 250 or more | 65 | 0.3% |
The count rose 12.2% between 2022 and 2026, after a small fall in 2023.
| Year | UK advertising agencies |
|---|
| 2022 | 16,915 |
| 2023 | 16,635 |
| 2024 | 16,955 |
| 2025 | 17,485 |
| 2026 | 18,985 |
All shares and percentage changes in these tables are calculated from the ONS rounded counts, not published directly by ONS. Figures are rounded to the nearest 5 by ONS itself, so calculated shares carry that same rounding.
Comparing agency numbers against your own competitive set is easier with a proper diagnosis of where you stand. A fixed-fee SEO audit covers technical, content and AI-visibility review against agencies of any size. For what people in these roles earn, see my UK marketing salary statistics from ONS pay data.
Source: ONS, UK business: activity, size and location, 2026, published 24 September 2026. Dataset: UK business: activity, size and location. IDBR snapshot 13 March 2026, VAT and/or PAYE based enterprises, figures rounded to the nearest 5.
How should you use SEO click-through-rate benchmarks?
CTR is clicks divided by impressions. A useful benchmark needs comparable queries, devices, countries and ranking definitions. A single position-one percentage cannot forecast every website's traffic.
My July 2026 portfolio CTR sample is withdrawn as a benchmark. It had no UK filter or brand exclusion, and its position-one bucket held five query rows.
The Google CTR guide compares published CTR studies and shows how to benchmark your own data. Compare your own Search Console data within consistent country, device and brand segments. Keep low-volume buckets visible instead of treating a small sample as a universal target.
What do AI and zero-click statistics tell you?
Zero-click searches, AI-summary reading and referral sessions measure different events. A user can read an answer without opening its source. A referral records a visit but does not count every citation that preceded it.
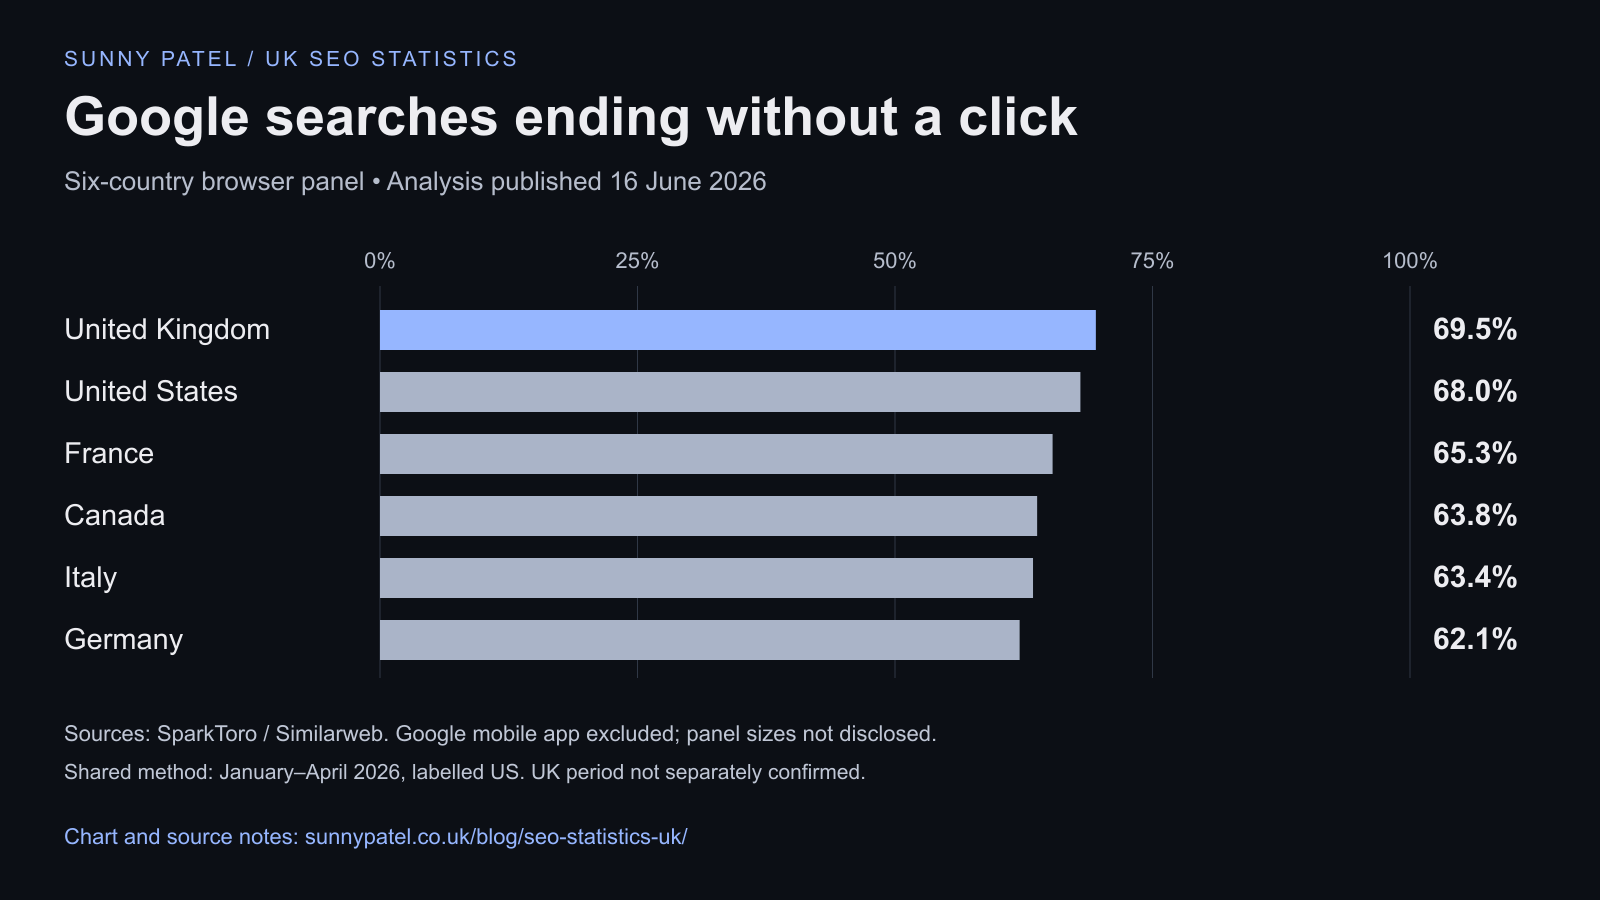
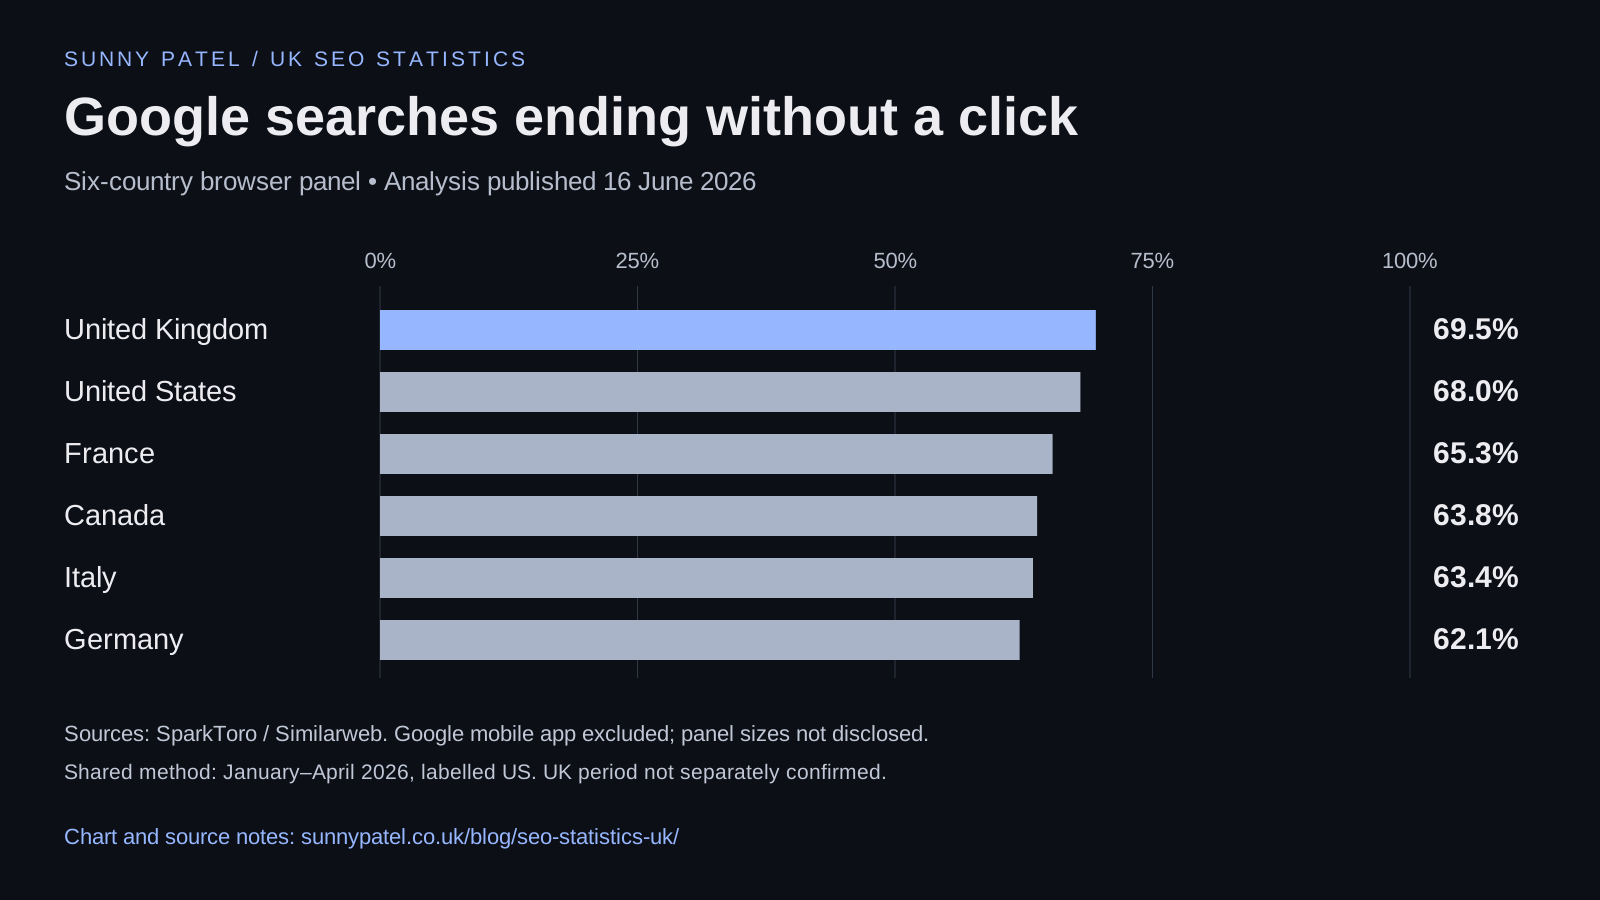
SparkToro's June 2026 comparison reports a 69.5% UK zero-click rate. Its shared methodology gives January–April 2026 but labels that line “US”; the UK period is not separately confirmed.
The page excludes Google mobile-app searches and does not disclose country panel sizes. The chart preserves the published country figures without claiming a national census.
Pew's US comparison associates AI summaries with fewer conventional-result clicks. The study captured search-result pages after the original searches.
Different query groups and delayed capture limit causal conclusions. These results cannot show how much traffic a particular UK site lost to AI Overviews.
My AI referral traffic study supplies a separate portfolio observation. The refreshed source reports 4,717 identified sessions across 12 selected sites.
That selection favours sites already receiving AI traffic. Citation frequency, all-traffic share and incremental revenue require additional evidence.
How can these statistics support an SEO business case?
An SEO business case needs your own incremental contribution profit and total delivery cost. Market adoption and referral shares provide context. They do not determine the return from your campaign.
Calculate return as: (incremental contribution profit attributable to SEO − total SEO cost) ÷ total SEO cost × 100. Include content, development, tools and internal delivery time in the cost. State the attribution approach and time period before presenting a percentage.
Model a conservative, central and optimistic scenario. Use qualified enquiries or completed sales where those outcomes are available.
Separate observed results from the forecast. Allow for seasonality, changes in demand and other marketing activity when interpreting the result.
The SEO ROI calculator provides a starting point for scenario planning. Read its assumptions before using an output in a budget decision. A vendor's average ROI, cost per lead or close rate is not a substitute for the economics of your business.
If you want a second opinion on your own numbers before committing budget, a fixed-fee SEO audit gives you a prioritised, costed action plan instead of a generic benchmark.
How were these statistics selected and checked?
This compilation prioritises primary research with an identifiable source, geography and measurement definition. Sources were checked on 12 September 2026. Fieldwork dates remain attached to the individual entries, including older studies published or reviewed in 2026.
Ofcom and the CMA provide UK survey or regulatory evidence. IAB UK reports industry expenditure. Statcounter and Similarweb use proprietary measurement panels.
Pew supplies observed US browsing behaviour. BrightLocal supplies a screened US consumer survey. Each design has limits that belong beside the headline.
The four portfolio entries are author-owned observations. The CTR arithmetic was checked against the repository's aggregate JSON and extraction script.
AI referral totals were checked against the published sector table. Private underlying analytics were not independently audited or newly collected for this refresh.
Statcounter's latest figures can be revised. The snapshot links specify August 2026; access dates describe our check.
Ofcom's 2025 survey redesign limits simple comparisons with earlier editions. The 52% advertising-recognition figure means respondents selected only the correct paid-placement answer.
This refresh removes unsupported local-intent and Local Pack click percentages, generic SEO ROI claims, speculative explanations for indexing changes and stale AI referral totals. It also replaces the broad “SEO industry revenue” headline with clearly defined paid-search expenditure. Corrections improve scope rather than silently changing a study's denominator.